ON THIS PAGE:
- State Dam Safety Program Performance Overview
- Key Awareness Resources
- Videos - Learning About Dam Failures
State Dam Safety Program Performance Overview
Dams are a critical part of the nation’s infrastructure, providing vital benefits such as flood protection, water supply, hydropower, irrigation and recreation. Yet thousands of US dams have the potential to fail with tragic consequences. Our nation’s dams are aging and deteriorating while downstream populations are increasing; this situation demands greater attention to and investment in measures that reduce risks to public safety and economic assets.
As of 2022, State Dam Safety Programs regulate 70% of the 92,075 dams listed in the National Inventory of Dams (NID). State dam safety programs inspect existing dams, oversee remediation of deficient dams, and work with local officials and dam owners on emergency preparedness. Many state programs lack adequate budgets, staff and authority to ensure public safety.
Dam Ownership
(2021 NID & 2021 State Program Performance Data)
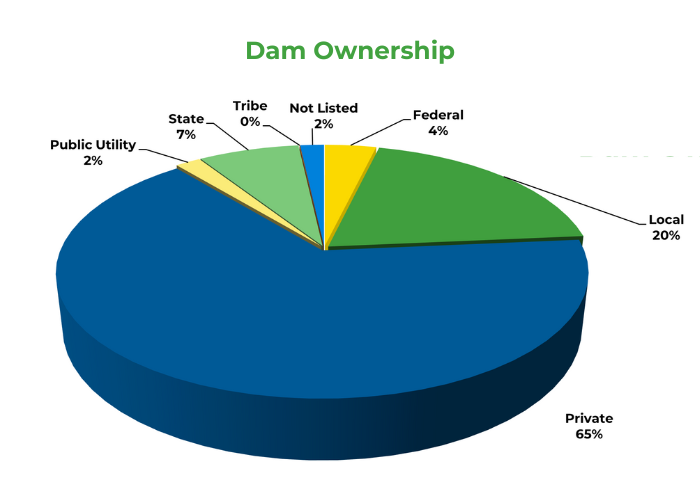
Unlike Most Components of US infrastructure, the majority of dams listed in the National Inventory of Dams are privately owned. (Dam ownership percentages are based on the 2019 NID dataset for total NID-sized dams.
Building State Programs to Address Deficient Dams
The National Dam Safety Program, in cooperation with the Association of State Dam Safety Officials (ASDSO), developed the Model State Dam Safety Program to assist state officials in initiating or improving their state programs. The model outlines the key components of an effective dam safety program and provides guidance on the development of more effective and sustainable state programs to minimize risks created by unsafe dams. It contains chapters on Legislative Authorities, Permitting, Inspection, Enforcement, Emergency Action
Planning and Response, Education and Training, and Public Relations.
The following table presents the weighted average of state responses over time to a series of yes/no questions on the authorities for each chapter. The areas are listed and weighted by importance (weights indicated in parentheses). Higher percentages indicate greater alignment of the state programs with the model.

Identifying the Problem
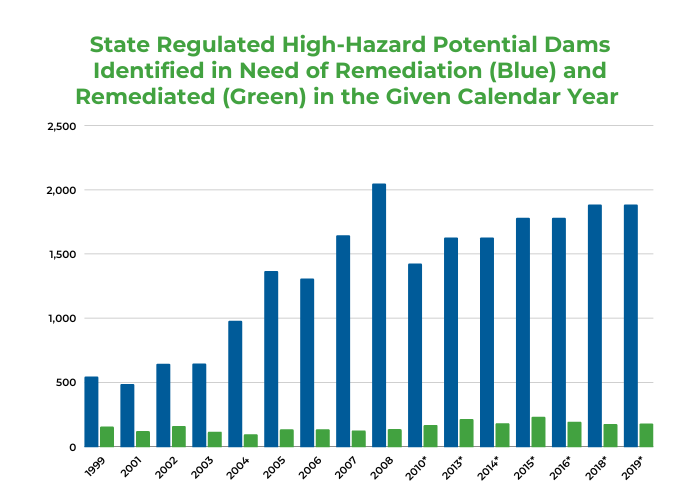
*2010 - 2019 data from NID condition assessment with not all State Regulated HHP dams being reported (86%in 2019). Prior years’ data was anecdotal totals reported by each state to ASDSO. The condition assessment field, instituted by the NID in 2009, provides more accurate data on remediation needs than the anecdotal totals.
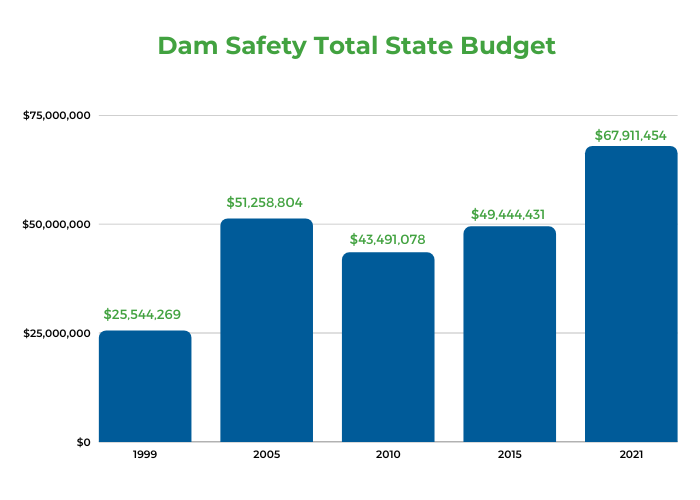
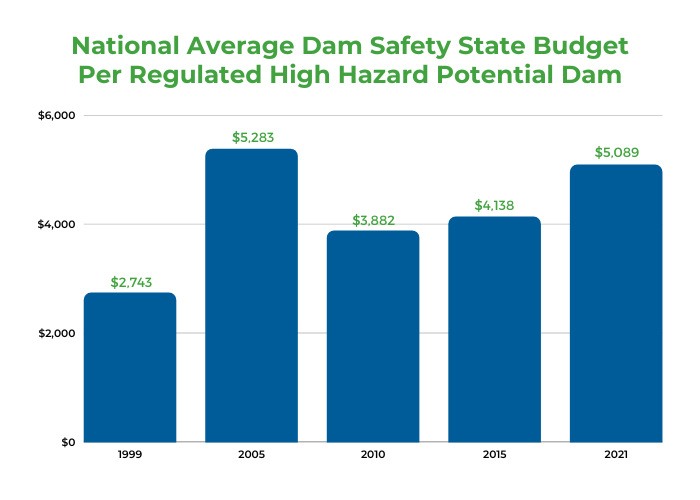
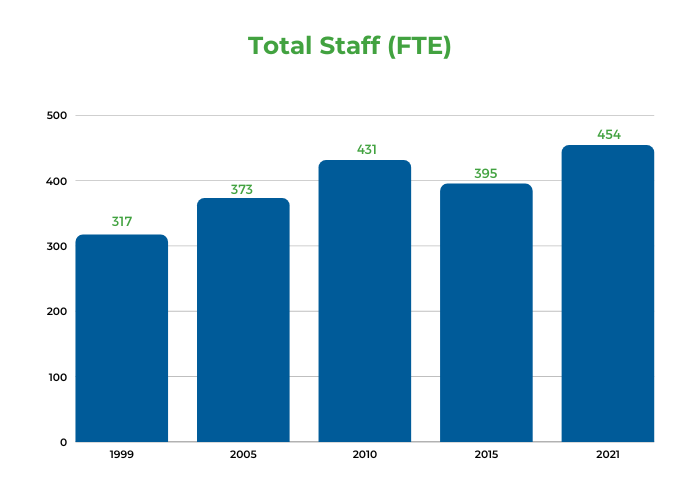
Advances in Resources for State Dam Safety Programs
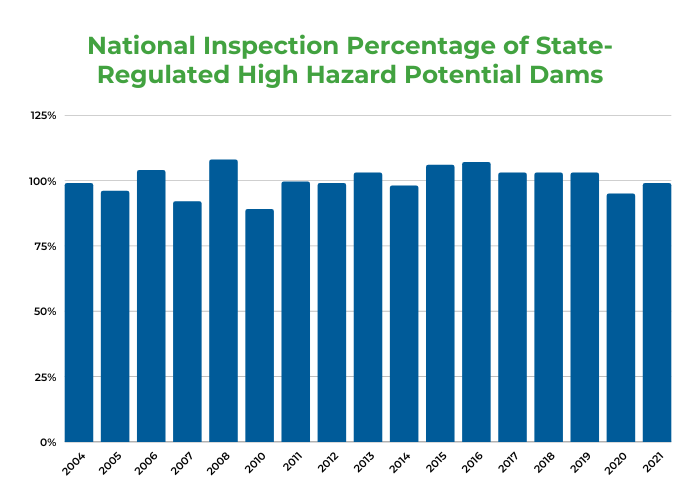
Inspection of High Hazard Potential State Regulated Dams Remains a Strength
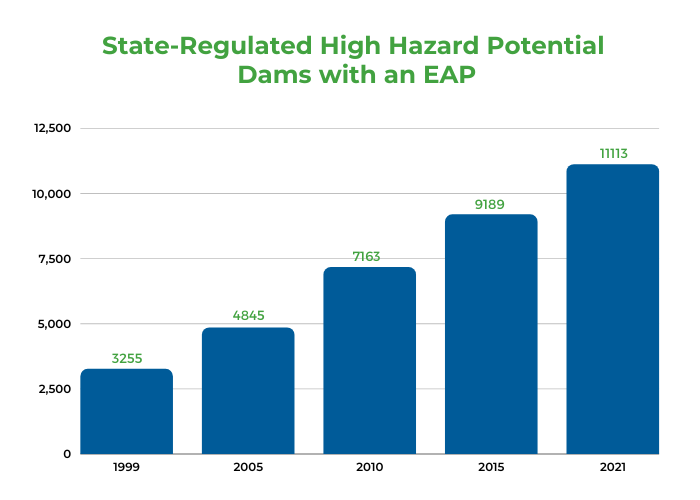
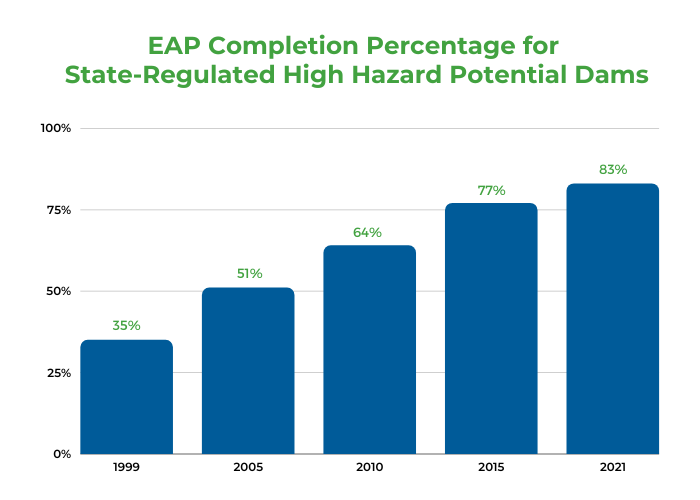
Improvement in Emergency Preparedness for High Hazard Potential Dams
Key Awareness Resources
- Booklet - Living Near Dams: Know Your Risks
- Booklet - Living Near Dams: Extreme Rainfall Events
- Report - The Cost of Rehabilitating Dams in the U.S. (2023)
- Report - ASCE Infrastructure Report Card: Dams


